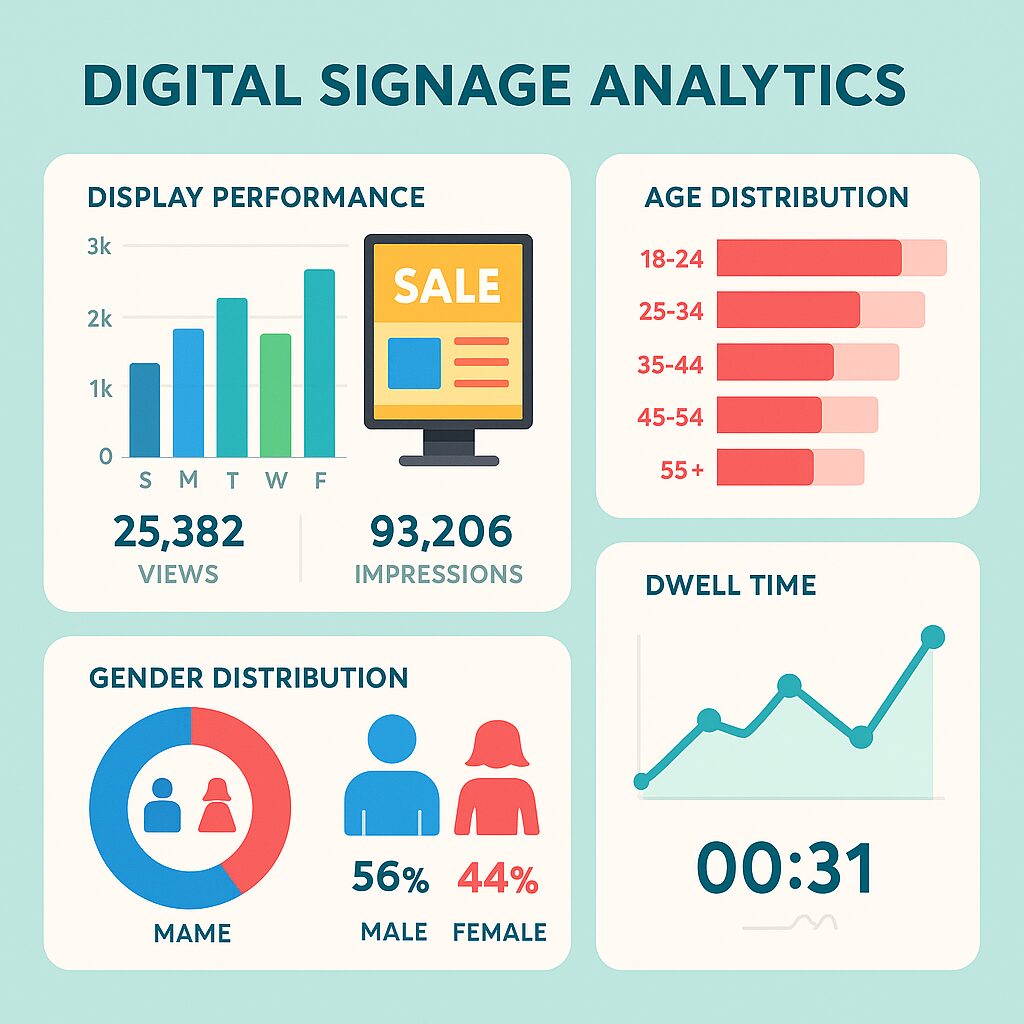
Running successful digital signage campaigns isn’t just about installing the brightest SMD screen anymore. After spending over 15 years in Pakistan’s digital display industry, I’ve witnessed businesses waste millions on spectacular P2.5 indoor displays and P10 outdoor billboards that looked amazing but delivered zero measurable results. The real game-changer? Understanding exactly how your audience interacts with your content and measuring what actually drives business outcomes.
The harsh reality is that most Pakistani businesses are flying blind with their SMD screen investments. They’re measuring impressions instead of engagement, counting views instead of conversions, and wondering why their expensive outdoor displays aren’t translating into foot traffic or sales. This comprehensive guide will transform how you approach digital signage analytics, turning your SMD screens from costly decorations into powerful business intelligence tools.

Understanding Digital Signage Analytics
Let’s start with the fundamentals. Digital signage analytics isn’t just about counting how many people walked past your P4 outdoor SMD screen in Lahore’s MM Alam Road. It’s about understanding viewer behavior, measuring engagement depth, and connecting screen performance to actual business results. The integration of these data-driven strategies will drive the future of digital signage, signifying a strategic shift towards utilizing data-driven insights for creating highly personalized campaigns.
In my early days installing SMD screens across Karachi’s commercial districts, I remember a retail client who spent 2.5 million rupees on a stunning P3 indoor video wall for their showroom. Beautiful display, crystal-clear 1920×1080 resolution, but after six months they couldn’t tell me if it was actually helping sales. That’s when I realized the industry needed to evolve beyond just technical specifications.
Key Performance Indicators
The foundation of effective digital signage measurement lies in tracking the right metrics. Here’s what actually matters for Pakistani SMD screen deployments:
Engagement Metrics:
- Dwell time (how long viewers actually watch your content)
- Interaction rates for touch-enabled displays
- Content completion rates
- Peak viewing hours aligned with local prayer times and business patterns
Audience Analytics:
- Demographic breakdown (age, gender estimation)
- Traffic patterns during different seasons
- Behavior changes during Ramadan and Eid periods
- Response to multilingual content (Urdu, English, regional languages)
Business Impact Measures:
- Conversion rates (screen views to store visits)
- Sales correlation during campaign periods
- Brand recall improvement
- Customer journey mapping from screen to purchase
Content Performance Measuremen

Content is king, but context is queen – especially in Pakistan’s diverse market. Your P6 outdoor SMD screen in Islamabad’s Blue Area will perform differently than the same content on a P2.5 indoor display in Lahore’s Emporium Mall. Understanding these performance variations is crucial for campaign optimization.
Real-Time Analytics Tools
Modern SMD screen management systems provide instant feedback on content performance. I’ve found that Pakistani businesses respond exceptionally well to real-time data when it’s presented in contextually relevant ways. AI and Machine Learning are revolutionising digital signage, increasing its capabilities and adaptability. These technologies allow for the customisation of content in real-time, taking into consideration audience demographics, weather conditions, and current events.
Essential Analytics Features:
- Heat mapping showing which screen areas attract most attention
- Play-through rates for video content
- Social media integration tracking
- Weather-responsive content performance
- Time-of-day optimization data
Audience Behavior Analysis
Understanding your audience goes beyond basic demographics. During a recent installation at a major shopping center in Karachi, we discovered that content performed 40% better when adjusted for local viewing patterns. Friday afternoons required different messaging than Monday mornings, and content during cricket matches needed completely different approaches.
Behavioral Patterns to Track:
- Viewing angles and distances
- Group versus individual viewing preferences
- Response to call-to-action elements
- Seasonal content preference changes
- Language preference variations by location
ROI Measurement Strategies
Return on investment measurement for SMD screens requires a multi-layered approach. It’s not enough to calculate cost per impression – you need to understand the entire customer journey from initial screen exposure to final purchase decision.
Cost-Per-Engagement Analysis
Traditional advertising metrics don’t translate directly to digital signage. A P8 outdoor display in Multan’s busy commercial area might have lower CPM than a P3 indoor screen in an upscale Lahore mall, but the engagement quality could be vastly different.
ROI Calculation Framework:
- Installation and operational costs versus engagement metrics
- Content creation expenses against conversion rates
- Power consumption costs (crucial in Pakistan’s energy scenario)
- Maintenance expenses versus screen longevity
- Seasonal performance variations affecting annual ROI
Attribution Modeling
Connecting screen exposure to actual business results requires sophisticated attribution models. I’ve helped clients implement systems that track customers from initial SMD screen exposure through to final purchase, revealing

